Aftersages MENA Automotive Supply Chain & Parts Intelligence Study 2026
The Hormuz Shock: Parts Department Economics, Corridor Bottlenecks, and the OEM Network Response to the Gulf’s Broken Supply Chain.
Since 28 February 2026, the Strait of Hormuz — the maritime artery through which the overwhelming majority of vehicles, genuine parts, lubricants, tyres, and workshop consumables entered the GCC — has been effectively closed to commercial shipping. Daily transits collapsed by more than 95% from a pre-war average of roughly 130–138 vessels; on 9 August 2026 a single ship passed through. Container rates from Asia to Jebel Ali have more than tripled, war risk surcharges of $1,500–$4,000 per container are standard, and total shipping costs on Gulf lanes have risen 125–180%. Base oil supply is running 44% below normal capacity, forcing OEMs into dealer-level lubricant rationing. Yet aftersales demand across the region is rising, not falling: new vehicle sales are projected down 11.5–12% in 2026, which means the existing parc must be kept running longer, on constrained parts supply, at inflated landed costs. This study maps the crisis as it stands in August 2026, dissects every corridor and bottleneck, quantifies the new cost stack, and builds the playbook for OEM regional parts and aftersales teams that intend to protect fill rates, defend margin, and emerge structurally stronger.
Report Contents: 8 Parts · 12 Charts · 6 Corridors Analysed
Executive Summary
On 28 February 2026, the outbreak of the Iran war closed the Strait of Hormuz to normal commercial traffic. Six months later, after a failed round of talks, a US naval blockade, a 60-day reopening memorandum in June, and renewed hostilities in July and August, the strait remains effectively shut: convoys move under naval escort, and daily transits are a fraction of the pre-war norm. For the GCC automotive aftermarket, this is not an energy story. It is a physical parts availability story. The region imports essentially everything a parts department sells — genuine parts, lubricants, tyres, batteries, paint, chemicals — and the primary gateway for all of it sat inside the closed strait.
The system has not collapsed; it has re-routed, at enormous cost. Cargo now lands at Khor Fakkan and Fujairah on the UAE’s Gulf of Oman coast, at Sohar and Salalah in Oman, and at Jeddah and King Abdullah Port on the Red Sea, then moves overland by truck. Dubai Customs has opened a dedicated transit corridor allowing containers landed on the east coast to move by road directly into Jebel Ali and the free zones. But every workaround has hit its own ceiling: Jeddah became so congested that Saudi authorities imposed a 15-day port-exit rule and major carriers stopped accepting in-transit bookings; east-coast gateways were never sized for Gulf-scale volume; trucking rates across the GCC have surged 50–60% with diesel up 45–50%; and the Houthi maritime blockade of Saudi-linked shipping announced in July has put the Red Sea corridor itself under renewed threat.
The commercial consequences inside the parts business are compounding. All-in container rates from Shenzhen to Jebel Ali reached $8,250–$9,500 per 40HQ in early August — with four surcharge layers stacking — versus roughly $2,000–$2,500 before the crisis. War risk surcharges alone run $1,500–$4,000 per container. Lubricants are the sharpest single shortage: the strike on Shell’s Pearl GTL facility in Qatar removed a major share of global Group III base oil capacity, supply is running roughly 44% below normal, and OEMs including Nissan and Toyota have issued dealer bulletins rationing synthetic oils. Meanwhile aftersales demand is rising: with new vehicle sales down ~12% and EV waitlists stretching to five months, customers are holding and servicing existing vehicles — the classic crisis aftersales paradox.
The strategic conclusion of this study is direct: the OEM parts operations that win the next 24 months will be those that treat multi-corridor routing, deeper regional safety stock, disciplined VOR triage, lubricant contingency, and transparent customer communication as permanent capabilities — not emergency improvisations. Part 7 sequences the ten moves. Part 8 maps the three scenarios through 2028 and the structural changes — multi-gateway architecture, regional warehousing, GCC rail, and localisation — that will outlast the war.
The Shock: Anatomy of the Hormuz Closure PART 01
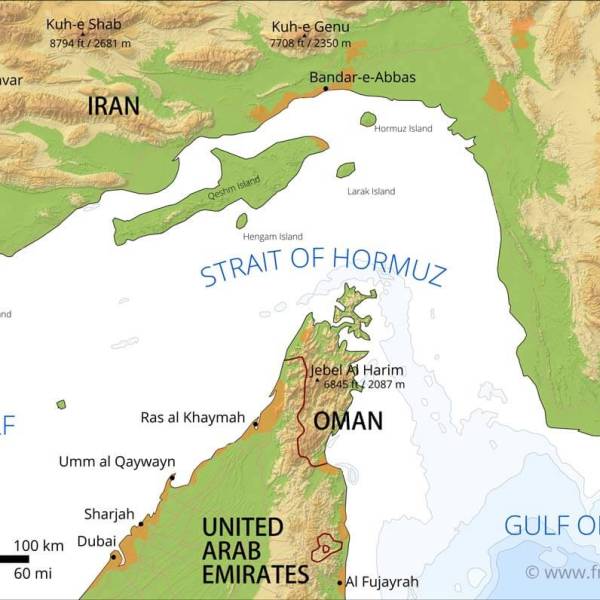
The Strait of Hormuz is a 33-kilometre-wide passage between Iran and Oman handling roughly 11% of global maritime trade and a fifth of the world’s daily oil flow. Before 28 February 2026, approximately 130–138 vessels transited daily. Understanding the sequence of the crisis matters for parts planning, because each phase produced a different operational reality — and the pattern of partial reopenings followed by re-closure is precisely what makes single-corridor planning untenable.
The Crisis Timeline: Six Phases That Reshaped Gulf Logistics
Figure 1: Strait of Hormuz Daily Commercial Transits, Indicative Trajectory Feb–Aug 2026
FIG 01Indicative daily transit trajectory reconstructed from Lloyd’s List Intelligence, UANI, BBC Verify and NBC News tracking data. The June MOU produced only a partial, short-lived recovery before the July re-closure. The pattern — closure, partial reopening, re-closure — is the single most important planning input for parts logistics: no corridor decision can assume the strait’s status is stable for longer than a news cycle.
The Architecture That Broke: How Parts Reached MENA PART 02
To understand the bottlenecks, you must first understand the machine that was running before February. The GCC parts supply chain was a hub-and-spoke system of remarkable efficiency — and remarkable concentration. That concentration is now the vulnerability.
The pre-crisis flow was simple: parts manufactured in Japan, Korea, China, Thailand, India, Germany and Eastern Europe consolidated at origin, sailed via the Indian Ocean through the Strait of Hormuz, and discharged overwhelmingly at Jebel Ali — the largest container port in the Middle East, handling 13+ million TEU annually and functioning as the transshipment hub for the Middle East, East Africa and South Asia. Regional distribution centres in JAFZA and Dubai South fed national importers and dealer networks across the UAE, and feeder vessels or trucks moved onward stock to Saudi Arabia (also served directly via Dammam and Jubail inside the Gulf), Kuwait, Qatar, Bahrain, Oman and the Levant. Air freight through DXB, DWC and AUH carried VOR (vehicle-off-road) emergency orders and high-value electronics. The entire system assumed 10–20 day predictable ocean lead times from Asia and 2–4 day regional distribution.
Figure 2: Genuine Parts Lead Times Into GCC Dealers, Pre-Crisis vs. August 2026, by Channel (Days, Aftersages Estimates)
FIG 02Aftersages operational estimates from GCC dealer and importer engagements. Ocean lead times from Asia have roughly doubled to tripled once Cape routings, east-coast transshipment, feeder waits and overland legs are included. Even air freight — the traditional VOR safety valve — has lengthened as capacity constraints and longer routings around conflict airspace slow uplift. The land bridge via Jeddah, briefly the star alternative, now carries its own congestion penalty.
Five Structural Vulnerabilities the Crisis Exposed in OEM Parts Networks
The Bottleneck Map: Ports, Corridors, Trucks, Empties PART 03
Six months in, the bottlenecks have migrated. The initial chokepoint was the strait itself; the current chokepoints are the workarounds. Each alternative gateway has absorbed volume it was never designed for, and the congestion has moved through the system in waves — first Jebel Ali, then the east-coast ports, then Jeddah, now trucking capacity and empty container logistics across the whole region.
Figure 3: The Gateway Shift — Indicative Container Volume Index by Entry Point, Q4 2025 vs. Q2–Q3 2026 (Pre-Crisis = 100)
FIG 03Indicative index built from carrier advisories, port reporting and AGBI/Drewry commentary. Cargo destined for the Gulf has shifted massively to Fujairah and Khor Fakkan in the UAE and Sohar and Salalah in Oman — all outside the strait and all attracting new port and logistics investment — while some operators serve the region through Jeddah on the Red Sea. Khor Fakkan has never handled more than 3 million TEU in a year against Jebel Ali’s 13+ million: the mathematics of the substitution explain the congestion.
Where the System Is Binding Right Now
| Bottleneck | What Is Happening | Status, August 2026 | Parts Department Implication |
|---|---|---|---|
| Strait of Hormuz | Effectively closed to commercial shipping; convoys under naval escort only; US blockade reimposed after renewed attacks. | Critical — 1 transit on 9 Aug vs. ~73/day norm | No planning assumption should include direct Gulf sailings. Any Hormuz transit that does occur carries carrier fees (e.g. Maersk’s $1,000/container) plus elevated insurance. |
| Jebel Ali | Fully operational, no damage; spring congestion from stranded and diverted vessels eased by late July — but deep-sea carrier calls remain a fraction of pre-war frequency. | Open but underfed | The RDC infrastructure works; the problem is upstream. Cargo reaches Jebel Ali mainly overland from east-coast ports via the Dubai Customs transit corridor. |
| Khor Fakkan / Fujairah | UAE east-coast gateways outside the strait absorbing diverted deep-sea calls; Dubai Customs corridor allows road transit to Jebel Ali and free zones under customs control without clearance at point of entry. | Operational, congested at peaks | The primary UAE workaround. Book early, expect yard dwell, and budget the overland leg plus transit-declaration administration. |
| Sohar / Salalah / Duqm (Oman) | Functioning as the main non-Hormuz maritime workaround for the wider Gulf; bonded trucking into GCC markets active; periodic severe congestion; Salalah recovered after the March drone strike. | Operational, capacity-constrained | Strong option for Saudi Eastern Province, Qatar, Kuwait and Bahrain onward flows — but feeder slots and trucks are the scarce resources, not berths. |
| Jeddah & the Saudi land bridge | The land bridge (Red Sea discharge + trucking across Saudi Arabia to the UAE, Qatar, Kuwait, Bahrain) worked — until volume overwhelmed Jeddah. Saudi authorities now require in-transit cargo to exit within 15 days or face penalties; most major carriers stopped accepting in-transit bookings via Jeddah, redirecting to King Abdullah Port, Djibouti and Mundra. | Constrained by policy + congestion | Still viable for Saudi-destined cargo; increasingly unreliable for GCC transit cargo. Confirm carrier acceptance before committing purchase orders to this routing. |
| Red Sea / Bab el-Mandeb | Houthis announced a maritime blockade of Saudi-linked shipping on 13 July; Bab el-Mandeb traffic fell 24% before stabilising; disruption concentrated in tankers so far; Suez east–west container share remains far below pre-2023 levels (~19%). | Elevated risk, functioning | The Red Sea workaround now carries its own war-risk premium. Watch for escalation triggers — a broadening of Houthi targeting would collapse the land bridge’s economics overnight. |
| GCC trucking | Overall road freight rates surged 50–60%+ on diesel (+45–50%), scarce capacity, and repositioning demand; road war-risk insurance near conflict zones up ~50%; UAE–Saudi and UAE–Oman borders carrying record volumes with 2–5 day buffers advised. | Operational, expensive | Truck capacity must be secured proactively and contractually — spot procurement in this market is where landed costs blow out fastest. |
| Empty containers | Empties stranded in wrong locations region-wide; carriers restricting return depots across the UAE, Qatar, Bahrain, Kuwait, Jubail, Iraq and Duqm; repositioning premiums charged. | Structural friction | Detention and demurrage exposure has become a real P&L line. Parts logistics teams must track per-container free time and return-depot status actively. |
The Cost Stack: What a Part Costs Now PART 04
The landed cost of a genuine part into a GCC dealer has been rebuilt from the ground up by the crisis. Four surcharge layers now stack on ocean freight, an overland leg has been inserted into most routings, insurance has repriced, and demurrage exposure is real. Parts pricing teams that have not rebuilt their landed-cost models since February are flying blind on margin.
The Surcharge Stack: Layer by Layer
Figure 4: All-In Container Rate Evolution, Shenzhen → Jebel Ali per 40HQ, 2026 (USD)
FIG 04Rate trajectory from carrier quotes and freight market reporting: pre-crisis levels near $2,000–$2,500 gave way to successive surges, reaching $8,250–$9,500 all-in (including WRS, ECS, EFS and PSS layers) in early August 2026 — a 35–55% jump from July alone, with the SCFI Persian Gulf index at $4,894/TEU and some carriers sold out with sailings blanked. Total shipping costs on Gulf lanes have risen 125–180% depending on route and cargo type.
Figure 5: Anatomy of a Crisis-Era Landed Part, Cost Composition Into a GCC Dealer (Aftersages Model, Aug 2026)
FIG 05Aftersages modelled decomposition for a representative mid-value genuine parts consignment routed Asia → east-coast gateway → overland → RDC → dealer. Freight, surcharges, insurance, the overland leg and demurrage/handling now represent roughly a third of landed cost versus a low single-digit share pre-crisis. Every percentage point of this stack that pricing files fail to reflect is margin silently surrendered.
Alternative Corridors: What Actually Works PART 05
There is no single replacement for the Hormuz–Jebel Ali artery. What exists is a portfolio of corridors, each with a distinct cost, lead time, capacity ceiling and risk profile. The OEM parts operations performing best in August 2026 are running deliberate allocations across three or more of these simultaneously — matching cargo criticality to corridor characteristics rather than chasing the cheapest quote.
Figure 6: Corridor Selection Matrix — Landed Cost Premium vs. Reliability, Bubble = Practical Capacity (Aftersages Assessment, Aug 2026)
FIG 06Aftersages assessment scoring each corridor on landed-cost premium versus pre-crisis baseline (x-axis), schedule reliability (y-axis), and practical capacity (bubble size). No corridor sits in the ideal upper-left. The optimal strategy is portfolio allocation: east-coast and Oman gateways carry the volume, air carries the criticality, the land bridge carries Saudi-destined cargo, and direct Gulf sailings are treated as opportunistic upside only.
Figure 7: GCC Parts Inbound Routing Mix, 2025 vs. August 2026 vs. 2028 Projection (% of Volume, Aftersages Model)
FIG 07The routing revolution in one chart: direct Hormuz sailings fell from roughly nine-tenths of inbound parts volume to a residual escorted trickle, replaced by east-coast and Oman gateways plus the land bridge and expanded air freight. The 2028 projection assumes partial strait normalisation — but with a permanently diversified mix, because no OEM board will again sign off a single-gateway architecture.
Inside the Parts Department: Stock, VOR & the Aftersales Paradox PART 06
The macro logistics story lands, ultimately, at a parts counter. This section maps what the crisis looks like inside the dealership — and why, counterintuitively, it is creating the strongest aftersales demand environment in years for the operations that can actually supply it.
The Aftersales Paradox: Why Demand Is Rising While Supply Is Constrained
Figure 8: Parts Availability Status by Category, GCC Dealer Networks (Aftersages Assessment, Aug 2026, % of References)
FIG 08Aftersages assessment from GCC dealer and importer engagements. Lubricants and chemicals/paint are the most acutely stressed categories — a direct consequence of the base oil shortage and petroleum-derivative disruption — followed by collision parts (compounded by aluminium cost inflation of ~13%) and EV/battery components dependent on Chinese sea freight. Fast-moving service parts have held up best where RDC buffers existed, but backorder tails are lengthening on long-lead references.
Figure 9: The Parts Department Squeeze — Demand, Cost and Fill-Rate Indices, GCC 2026 (Jan = 100, Aftersages Model)
FIG 09The three lines that define the crisis inside the parts business: aftersales demand rising as the parc ages in place, landed cost inflation running far ahead of price-file updates, and fill rates sagging as safety stock burned off through Q2. The operations closing the gap between the demand line and the fill-rate line are the ones capturing the market share this crisis is redistributing.
The Parts Operations That Will Not Survive This Cycle
The Parts Department Playbook: 10 Moves PART 07
The following playbook is built for OEM regional parts directors, national importer supply chain managers, and dealer group aftersales leadership operating in MENA under current conditions. Each move is sequenced for impact and grounded in the corridor and cost analysis throughout this study.
Figure 10: Dealer Fill-Rate Trajectory, Baseline vs. Moderate vs. Full Playbook Implementation (Aftersages Model, 2026–2027, %)
FIG 10Modelled fill-rate trajectories under three implementation intensities, assuming the strait remains contested into 2027. The baseline operation continues bleeding availability as backorder tails compound; the full-playbook operation recovers toward pre-crisis fill rates by mid-2027 through corridor portfolio, deepened stock and network redistribution — and converts the gap into permanent service market share.
Scenarios & the 2027–2028 Map PART 08
Planning under this crisis means planning under explicit scenario branches, not point forecasts. The strait has changed operational status five times in six months. Below are the three branches every MENA parts strategy should carry, followed by the structural changes that will outlast all of them.
| Scenario | Shape | Supply Chain Consequence | Parts Strategy Posture |
|---|---|---|---|
| A — Negotiated Reopening | A durable arrangement (successor to the June MOU, potentially involving the Gulf states and Oman in strait administration) restores escorted then open commercial transit through late 2026 / early 2027. | Rates fall but do not snap back — war-risk pricing, carrier caution, backlog clearance and the Red Sea’s own risk premium keep costs elevated 12–18 months. Stranded backlog clearance temporarily floods gateways. | Hold the corridor portfolio through the transition; use falling rates to rebuild safety stock cheaply; lock service contracts with share gained during the shortage. |
| B — Frozen Conflict (Base Case) | The current pattern persists: contested strait, escorted convoys, periodic partial openings and re-closures, Houthi pressure on Saudi-linked Red Sea traffic flaring with the broader conflict. | The August 2026 cost stack becomes the operating environment. East-coast and Oman gateway investment accelerates; trucking and feeder capacity remain the binding constraints; lubricant stress persists into 2027 per ILMA. | Full playbook execution. Availability is the competitive weapon; the portfolio operator compounds share gains quarter after quarter. |
| C — Escalation | Renewed full-intensity conflict; broadened Houthi targeting collapses the Red Sea land bridge; direct strikes on Gulf port or energy infrastructure recur. | Air freight and Oman-side gateways become the only reliable channels; rationing extends beyond lubricants to multiple categories; vehicle and parts price inflation accelerates sharply. | Triage economy: protect warranty, safety and fleet-critical supply; maximise regional redistribution and reman; communicate relentlessly to hold customer trust. |
Five Structural Changes That Will Outlast the War
Figure 11: GCC Parts Landed-Cost Index Under Three Scenarios, 2026–2028 (Pre-Crisis = 100, Aftersages Model)
FIG 11Modelled landed-cost index paths. Even the reopening scenario does not return to the pre-crisis baseline within the horizon: war-risk memory, carrier caution, rebuilt inventory carrying costs and Red Sea risk pricing leave a durable premium. The planning implication is that crisis-era pricing discipline and cost-to-serve transparency are permanent requirements, not temporary measures.
Figure 12: The Resilience Gap — GCC OEM Parts Network Capability, Current vs. Required Standard (Aftersages Assessment, 2026)
FIG 12Capability assessment across 8 dimensions for OEM parts and distribution networks in the GCC. The widest gaps — multi-corridor routing, lubricant contingency, and live landed-cost visibility — are exactly the capabilities this crisis punishes hardest. Each gap represents fill rate surrendered and margin leaked to better-prepared competitors while the constraint environment persists.
Research Methodology & Data Sources
This study synthesises data from: Lloyd’s List Intelligence Hormuz and Red Sea transit tracking (2026), United Against Nuclear Iran (UANI) Iran War Shipping Updates (2026), NBC News Strait of Hormuz traffic tracker (2026), Congressional Research Service ‘The Strait of Hormuz: Security Developments and Impacts’ (2026), Maersk Middle East Operational Updates 40–41 (2026), Hapag-Lloyd and CMA CGM carrier advisories (2026), Crane Worldwide Logistics Middle East Operations Updates (2026), Bertling Middle East Logistics Updates (2026), SeaVantage Hormuz Crisis Timeline (2026), S&P Global Mobility US–Iran War Global Auto Industry Impact Analysis (2026), AGBI Gulf automotive and shipping analysis (2026), Khaleej Times UAE EV market reporting (2026), CNBC base oils supply analysis (2026), CBT News and Carscoops lubricant shortage reporting (2026), Splash247 Dubai Customs corridor reporting (2026), Global Cold Chain Alliance Middle East Situation Reports (2026), USNI News and gCaptain Red Sea reporting (2026), Drewry port capacity data via AGBI (2026), freight market rate reporting (Great Hensen, Spoterix, Vortex Shipping, 2026), and Aftersages Automotive Consultancy proprietary assessments across GCC and Levant parts, importer and dealer operations (2022–2026). Figures identified as Aftersages models or estimates are analytical constructions from this evidence base and operational engagements; they are indicative and should be validated against each operator’s own data before investment decisions.
References
- Congressional Research Service (2026) ‘The Strait of Hormuz: Security Developments and Impacts on Oil, Gas, and Other Commodities’. Available at: congress.gov
- United Against Nuclear Iran (2026) ‘Iran War Shipping Updates’, May–June. Available at: unitedagainstnucleariran.com
- NBC News (2026) ‘Track Strait of Hormuz Ship Traffic’. Available at: nbcnews.com
- Maersk (2026) ‘Middle East Operational Update 41’, August. Available at: maersk.com
- SeaVantage (2026) ‘Strait of Hormuz Crisis 2026: Full Timeline & Ocean Freight Impact’. Available at: seavantage.com
- Carra Globe (2026) ‘Strait of Hormuz Closure 2026: What It Means for Your Supply Chain’. Available at: carraglobe.com
- S&P Global Mobility (2026) ‘US–Iran War: Global Auto Industry Impact’. Available at: spglobal.com
- AGBI (2026) ‘From Boom to Brake: Gulf Auto Market Under Pressure’, April; ‘Cape Route Threatens Jebel Ali’s Standing as Top Gulf Port’, August. Available at: agbi.com
- Splash247 (2026) ‘Dubai Opens Alternative Customs Corridor as Jebel Ali Disruption Mounts’. Available at: splash247.com
- The Cooperative Logistics Network (2026) ‘Jeddah Port Congestion 2026: A Guide to the Gulf Bottleneck’, July. Available at: thecooperativelogisticsnetwork.com
- CNBC (2026) ‘Strait of Hormuz: A Base Oils Shortage Threatens Luxury Auto Giants’, May. Available at: cnbc.com
- CBT News (2026) ‘Middle East Conflict Triggers Oil and Paint Shortages at Dealerships’, June. Available at: cbtnews.com
- Khaleej Times (2026) ‘UAE EV Demand Outstrips Supply as Waitlists Stretch to 5 Months’, July. Available at: khaleejtimes.com
- USNI News (2026) ‘Hormuz Transits Remain Low, Houthis Resume Attacks in Red Sea’, July. Available at: news.usni.org
- Lloyd’s List Intelligence (2026) ‘Red Sea Brief: 6 August 2026’. Available at: lloydslistintelligence.com
- Global Cold Chain Alliance (2026) ‘Middle East Conflict Disruption Updates & Situation Report’, March. Available at: gcca.org
- Crane Worldwide Logistics (2026) ‘Middle East Logistics Operations Update’. Available at: craneww.com
- Automotive Logistics (2026) ‘Iran War Continues to Impact Automotive Supply Chain’, March. Available at: automotivelogistics.media
- Yallamotor (2026) ‘Middle East Tensions Cutting 2026 Auto Sales: What GCC Buyers Should Expect’, July. Available at: yallamotor.com
Readers should conduct their own independent assessment and verify current corridor and carrier conditions before making business decisions.